Widrow-Hoff の学習規則でクラス分類
はじめに
わかりやすいパターン認識の第 3 章で Widrow-Hoff の学習規則が説明されていたので実装してみた。
コード
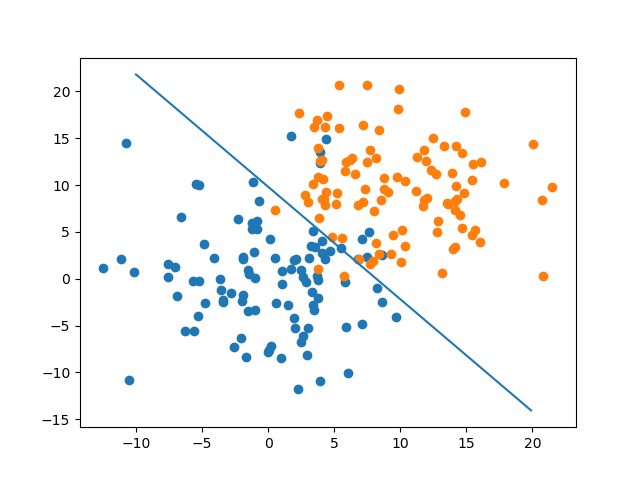
コードはこんな感じ。それぞれ 2 次元正規分布に従う 2 クラスのパターンで学習してみた。パターンはわざとクラス間で一部重なるようにしておいて、線形分離できないケースを試してみた。
from matplotlib import pyplot as plt
import numpy as np


class WidrowHoff:
    EPOCH = 100

    def __init__(self, n_dim, n_class, rho=1e-3):
        self.W = np.random.randn(n_class, n_dim + 1)
        self.rho = rho

    def train(self, data, label):
        for i in range(self.__class__.EPOCH):
            # shuffle
            perm = np.random.permutation(len(data))
            data, label = data[perm], label[perm]

            for x, y in zip(list(data), list(label)):
                # update weight
                X = np.repeat(np.array(list(x) + [1])[np.newaxis, :],
                              self.W.shape[0],
                              axis=0)
                E = np.repeat((self._predict(x) - y)[:, np.newaxis],
                              self.W.shape[1],
                              axis=1)
                self.W = self.W - self.rho * E * X

    def _predict(self, x):
        x = np.array(list(x) + [1])
        return np.dot(self.W, x)

    def predict(self, x):
        return np.argmax(self._predict(x), axis=0)


if __name__ == '__main__':
    # prepare dataset
    X_c0 = 5 * np.random.randn(100, 2)
    X_c1 = 5 * np.random.randn(100, 2) + np.array([10, 10])

    data = np.concatenate([X_c0, X_c1])
    label = np.array([[1, 0] for i in range(100)] +
                     [[0, 1] for i in range(100)])

    # train
    widrow_hoff = WidrowHoff(n_dim=2, n_class=2)
    widrow_hoff.train(data, label)

    # show
    plt.scatter(X_c0[:, 0], X_c0[:, 1])
    plt.scatter(X_c1[:, 0], X_c1[:, 1])

    w = widrow_hoff.W[0] - widrow_hoff.W[1]
    y = lambda x: w[0] / -w[1] * x + w[2] / -w[1]
    x = np.arange(-10, 20, 0.1)
    plt.plot(x, y(x))

    plt.show()
結果
こんな感じで決定境界が引けた。なんとなくそれっぽい境界になってそう。

そしてエポックごとにその時点での識別精度をグラフにしたものが以下。

今回のデータはそれぞれ平均が (0, 0) と (10, 10)、標準僅差が 5、x と y は独立の 2 次元正規分布を使ったことを考えると、(0, 0) と (10, 10) 間の距離 / 2 / 5 = 1.4142... ということで、標準正規分布で 1.414 よりも上側の確率と識別精度は一致するはず。
正規分布表を参照するとだいたい 0.079 くらいなので、グラフの値とおおよそ一致した。
まとめ
- Widrow-Hoff でクラス分類してみた
- 線形分離不可能なパターンでもいい感じに境界引けた
- 識別性能も理論値とだいたい一致した